Joyce Megumi Ishikawa

Data enthusiast with 2+ years of experience in media analytics & buying with a MSc in Applied Analytics from Columbia University.
Previously at Topolo, VaynerMedia and SteinIAS.
View My LinkedIn Profile
Download My Resume
Designing an Experimental Study on Customer Engagement on Instagram Shop
Authors: Joyce Ishikawa, Maria Pilar Bifaretti,
Chi Lee, Jingyi Li, Michelle Mai, Yancheng Yu
Part 1: Research Proposal
Executive Summary / Abstract
For over two years, Instagram has helped businesses and entrepreneurs build their digital storefronts through its shopping feature and has allowed users to shop easily. The platform growing business aims to help companies “reach new customers” by implementing features that make it easier for people to purchase products featured on our platform (Instagram, 2022).
This paper sought to learn what type of features increase users’ average daily session time on Instagram’s shop feed. The attributes studied were exposure to product categorization, creator product curation, and price and description in the feed. The study targeted Instagram users in the United States aged 18 to 57 who have used the Instagram shop feed in the past six months to evaluate the effect of the proposed changes. Users were assigned randomly to four groups, with 70 users in each group. Specifically, one control and three treatment groups (each for one of the proposed features). The study ran for five weeks, with two weeks of user experimentation. Moreover, the experiment ran between March and February to avoid seasonal effects (e.g. Christmas season).
A one-way analysis of variance test with the Tukey’s Honest Significant Difference (HSD) correction was conducted to evaluate the effect of each treatment group in comparison to the control group to review if a significant effect size was present. The mentioned research will allow us to address the following aspects:
- If the average session time does not increase with any of the 3 features, Instagram should not develop any of the changes.
- If the users’ average daily session time increases by 20% or more with the use of product categorization vs. not having it, the company should develop the feature.
- If the users’ average daily session time increases by at least 20% by having a feature that curates products based on creator’s recommendations, Instagram should develop the proposed feature.
- If the users’ average daily session time increases by 20% or more by clearly displaying the price and description of each product in the feed, Instagram should consider implementing the feature.
Statement of the Problem
The presence of social networks has revolutionized and stimulated e-commerce (Singh & Singh, 2018). Consequently, it has given life to a new form of buying and selling - social commerce. Social commerce is a form of online trade that uses social networks as a sales channel (Zhou, Zhang, & Zimmermann, 2013). It is a model that allows consumers to complete their entire shopping experience in a single place, from product discovery to purchase. As a result, this presents significant opportunities for large companies, small brands, and individuals. For the social platforms themselves, it is a new source of revenue and a way to increase engagement with their users.
For small businesses and entrepreneurs (influencers), it becomes a channel that facilitates engagement with their consumers, provides a space for developing new experiences, and empowers them to reassess their relevance in a marketplace with millions of potential buyers (Murdoch, Wright, Fang, Collins, & McCracken, 2022). Increasingly, social platforms worldwide have seen the potential and have developed stores inside their apps, such as WeChat, Facebook, Instagram, Pinduoduo, and others (Geyser, 2022).
In the United States, the social commerce market was valued at 36.09 billion dollars in 2021 (Lipsman, 2021). The research also noted that this figure has paled in comparison to regions of the world, particularly the east. Moreover, it reveals that China’s social commerce market is ten times bigger than the U.S. To put it into context, “eight out of ten social media users in China use social commerce to make purchases for a given category, while the majority of social media users in the U.K. and U.S. have yet to make a purchase via social commerce” (Murdoch, Wright, Fang, Collins, & McCracken, 2022).
This paper seeks to research if implementing specific features improves Instagram’s in-app shopping experience by increasing the average daily session time within the feed . A deep understanding of the best characteristics of social commerce can increase users’ interest and the value for the company and its stakeholders.
Research Questions and Hypotheses
In order to increase the in-app activity of Instagram’s social commerce, this study measured the user’s average session time within the Instagram Shop feed. Therefore, the present study seeks to answer the three research questions:
-
Does the exposure of categorization of products in the Instagram shop feed increase the user’s average daily session time in seconds on the shop feed and how does it differ from the lack thereof such a feature?
- Does the exposure of creator product curation in the Instagram shop feed increase the user’s average daily session time in seconds on the shop feed and how does it differ from the lack thereof such a feature?
- Does the exposure of price and description in the Instagram shop feed increase the user’s average daily session time in seconds on the shop feed and how does it differ from the lack thereof such a feature?
The null and alternative hypotheses corresponding to each research question are listed below:
Null Hypothesis 1: There is no improvement in the average daily session time between Instagram app users exposed to the categorization of products and the average daily session time of users not exposed to the new features in the Shop feed.
Mathematical notation: 𝜇 ≤ 46seconds
Alternative Hypothesis 1: There is an improvement in the average daily session time between Instagram app users exposed to product categorization and the average daily session time of users not exposed to product categorization in the Shop feed.
Mathematical notation: 𝜇 > 46 seconds
Null Hypothesis 2: There is no improvement in the average daily session time between Instagram app users exposed to the creator product curation and the average daily session time of users not exposed to the new features in the Shop feed.
Mathematical notation: 𝜇 ≤ 46 seconds
Alternative Hypothesis 2: There is an improvement in the average daily session time between Instagram app users exposed to creator product curation and the average daily session time of users not exposed to creator product curation in the Shop feed.
Mathematical notation: 𝜇 > 46 seconds
Null Hypothesis 3: There is no improvement in the average daily session time between Instagram app users exposed to the price and description and the average daily session time of users not exposed to the new features in the Shop feed.
Mathematical notation: 𝜇 ≤ 46 seconds.
Alternative Hypothesis 3: There is an improvement in the average daily session time between Instagram app users exposed to price and description and the average daily session time of users not exposed to price and description in the Shop feed.
Mathematical notation: 𝜇 > 46 seconds
The mean of the control variable of 46 seconds was derived from industry benchmarks for average time on page for the health and beauty (45 seconds) and fashion (47 seconds) industry (Contentsquare, 2022). These specific industry benchmarks were chosen because the top five industries using Instagram include fashion and health and beauty (Pixlee TurnTo, 2022). We will use a 20% increase in average daily session time as the minimum effect size for each independent variable. We believe a 20% increase in the session time is a meaningful effect because the difference in the mean of health, beauty, and fashion (46 seconds) and the mean of the time on page for all industries (55 seconds) is approximately 20% greater. In addition, a 20% effect size translates to an additional 9 seconds spent on the feed which reflects a greater engagement of the user. Therefore this effect size emphasizes the necessity of the feature to be incorporated into the Shop feed to improve customer engagement and conversions.
Importance of the Study and Social Impact
Significance of the Study
This study would be a great contribution to the vast knowledge in relation to the shop feature of Instagram. Furthermore, the results of this investigation could be highly significant and beneficial for the following:
Company/Stakeholders
The findings of this study would provide them with adequate information about the shop feature and how they can optimize it to increase revenue for the company. Furthermore, the study would provide the company and stakeholders with the opportunity to discover the benefits and advantages of the feature that might contribute to the company’s future. Companies and stakeholders would be able to discover if there is a need for them to add more features or improve on existing ones. This way, they can improve their product offerings and increase revenue as well. The study would provide them with information about their customers’ behavior when using the Instagram Shop feed. This information could help them determine how to attract more customers because it will give them ideas about what type of content should be posted on Instagram for people to engage with it and become interested in buying the company’s products or services.
Customers
For the users that do not know about the feature or that have not yet purchased anything from the feature. This study aims to attract more users to engage with the feature and help them find the best place to shop online. Moreover, for the users that are already using the feature, this study aims to increase their engagement and time spent on the shopping feed. Brands and Companies that use Instagram as a platform for marketing their products can use this research as an opportunity to gain more customers and expand their business.
Businesses/Influencers
With improvement in the Instagram Shop feed, customers will become more interested in buying products and services, which increases businesses’ sales and revenue and benefits influencers’ commissions. Thus, businesses and influencers will tend to shift all their shopping platforms to Instagram Shop and invest more, which eventually expands Instagram e-commerce.
Literature Review
Social media has grown substantially over the last few years and created new opportunities for companies to make more money. According to the United States Census (2020), e-commerce sales increased by $244.2 billion dollars in 2020. As COVID-19 spread and was officially declared a pandemic by the WHO, people started shifting their shopping habits online, and online sales increased by 32.4% compared to the previous year (Gokila, 2021). Traditional retail companies such as Best Buy and Target grew by over 100% in e-commerce sales during the pandemic (Gokila, 2021).
Consumers are experiencing new ways of buying stuff, whether it’s essential or recreational, which created a new business ecosystem, and companies are finding new ways to capitalize on the convenience of online shopping. With the huge new market emerging, different companies are trying to grasp onto the trend, and use what they know about customer behavior to try and lead the new opportunity. Suchánek and Králová (2015) have shown that customer satisfaction is directly correlated to a company’s performance and its profitability; however, customer satisfaction is not only affected by one but several factors such as customer experience, product quality, and company tradition.
With a better customer experience, the customer will be more likely to be involved in the company’s future offerings, which creates trading opportunities and enhances customer engagement. According to Hu and Chaudhry (2020), customer engagement refers to the reaction and connection between the customers and the firm’s offerings and activities. Although there is a substantial amount of research on consumer engagement in recent years, studies trying to figure out ways to increase consumer engagement are somewhat limited (Hu & Chaudhry, 2020).
Product Categorization
Product categorization increases consumers’ perceived variety of the assortment and reduces the perceived complexity of the products. These perceptions increase consumers’ purchase intention and satisfaction with the product (Rooderkerk & Lehmann, 2020). The previous study indicates that it is crucial for any shop to optimize its product categorization in order for them to turn shoppers into buyers.
When an Instagram customer’s internal product categorization is congruent with the shop’s categorization implied by the layout, they are more likely to think that there is more variety of products and more likely to buy the products. Vazquez et. al (2020) suggests that consumers evaluating products before their consumption has two main effects on e-commerce websites: they increase web traffic and decrease conversion rate. According to Cetinturk (2019), one of the most relevant metrics in evaluating any online service is looking at the average session duration. The study shows that the average time users spend on a site indicates how interesting or relevant the site is to the users.
A high average session time is an important indicator of consumer interest in the product and the website. As one of the largest social media platforms, Instagram has already captured the users’ attention and interest with its social media content, and now it is easier for them to use its algorithm to respond to users’ preferences and put the right products on the right shelf for the users.
Creator Product Curation
Chen et al. (2018) surveyed tens of thousands of online customers in the United States to comprehend trends in subscription e-commerce. According to their study, 15% of online buyers have subscribed to receive items regularly, most commonly through monthly boxes. The study is particularly interested in what constitutes 15% of online subscription shoppers. Chen found that 55% of online subscription consumers were also members of content curation services. In addition, the research result indicates that customers are more likely to register for an online shopping subscription plan, especially one that provides product curation if they had heard good things about it from others or read positive reviews about it online. The previous study shows that product curation leads to more recommendations on the shop’s feed and provides an opportunity to increase customer engagement.
Back to our research, customers tend to spend more time on Instagram Shop, offering more relevant and attractive recommendations by creator product curation, than other shopping platforms because they enjoy scrolling through the many interesting posts that appear on their feed every day, which in turn boosts the average daily session time of customers of Instagram Shop feed.
Price and Description
Various researchers have explored how price and description affect customers’ interest in Instagram feed. For instance, Yahia, Al-Neama & Kerbache (2018) argue that most potential customers who wish to buy products through the Instagram shop are usually more sensitive to the price of the products and their description than their relevance. Shoppers examine competing brands. Before making even the simplest purchase, people probably make an unconscious list of product descriptions and price tags (Weeks, Smith & Hulland, 2021). The previous finding means that when potential customers are viewing products through the Instagram feed, they tend to focus more on products with price tags within the reference price in their minds. All goods have an obvious alternative, although some are more apparent than others. There will be more price sensitivity if potential buyers can quickly and easily evaluate their goods compared to competing options. For example, it is easier to directly compare identical products with different brands when price and description are given as reference points.
Research Plan
Population of Interest
Mainly, users located in some countries in North America, Latin America, Europe, the Middle East, Africa, and Asia-Pacific (Instagram, 2022) are now eligible for shopping on Instagram. To be specific and generalized, the population of interest in our research study will be Instagram users in the United States aged between 18 to 57 who have used the Instagram shop feed in the past six months. There will be 280 respondents selected as our sample size, and this sample size is calculated in the sample size and statistical power section. According to Osman (2022), Millennials (26 to 41) and Gen Xers (42 to 57) are the age groups that contributed the most to eCommerce. Users aged between 18 to 25 are included because Gen Zers will soon become the next main eCommerce consumption force. Sample selection will be made based on age and region filled on user profiles. Users who did not use the Instagram shop feed in the past half year are excluded because this user group will not reflect shopping experience improvement. They will not notice the updated features as they did not use the feed previously.
Sample Selection
Firstly, the users would be randomly assigned to 4 groups (1 control and 3 treatments), with 70 users in each group. The first group is the control group, and there will be no additional upgrades to the control group users’ Instagram shopping feeds. The second group is the categorization group (treatment group #1), and there will be an update on presenting product categorization for users to filter based on interested merchandise categorization. The third group is the creator product curation group (treatment group #2). Users in the curation group will see creator product curation based on the accounts they follow. The last group is the price and description group (treatment group #3), where users will see the product price and brief product description under the product image.
When excluding users who did not use the shopping feed on Instagram, our possible population reduces. The excluded users can be analyzed in the future to see whether certain feature updates will attract users to start using the shopping feed.
Subjects are randomly assigned into different groups because a random experiment is the most robust design to mitigate the effects of confounding variables and to determine the causal relationship between independent variables and the dependent variable. By random sampling, we can ensure each group has similar user demographics. Both measured (average user session time) and unmeasured (potential confounding) variables in the control and treatment group will be balanced. This approach is feasible in our study because we are collaborating with Instagram, and we have access to anonymous user data to conduct the random experiment. Selected users will not find any difference until the date for the application update.
Operational Procedures
There is no additional instruction or training required for our participants. While collaborating with Instagram, we are conducting a single-blind study that participants who do not know which study group they belong to. If we were to recruit participants and tell them which study group they are assigned to, they could unconsciously vary their normal behavior and hence affect our study result. We want to eliminate the effect of participant bias by not informing participants in the study of anything related to our research topic. We only collected user information for the random assignment of the study, and all information will be anonymously collected.
The Instagram application will be updated simultaneously for all four groups on the experiment start date and will last for two weeks. The user’s average daily session time in seconds on the Instagram shopping feed will be measured and recorded throughout the two weeks.
After the experiment, we will compare the daily average session time of each treatment group to the daily average session time of the control group separately to see if there is any significant improvement in the users’ session time on the updated shopping feed. We will perform an Analysis of Variance (ANOVA) test to compare the mean outcomes for the four subgroups and use the Tukey’s Honest Significant Difference (HSD) Method to make pairwise comparisons. From the comparisons, we will either reject or fail to reject the null hypothesis. We will use a 20% increase in session time as the minimum effect size. Because a 20% increase in average daily session time from the original shopping feed features is equivalent to around 9 seconds. The greater the average daily session time represents, the more engagement the user has. Thus a nine seconds increase in average session time can reflect the necessity of each feature update.
Brief Schedule
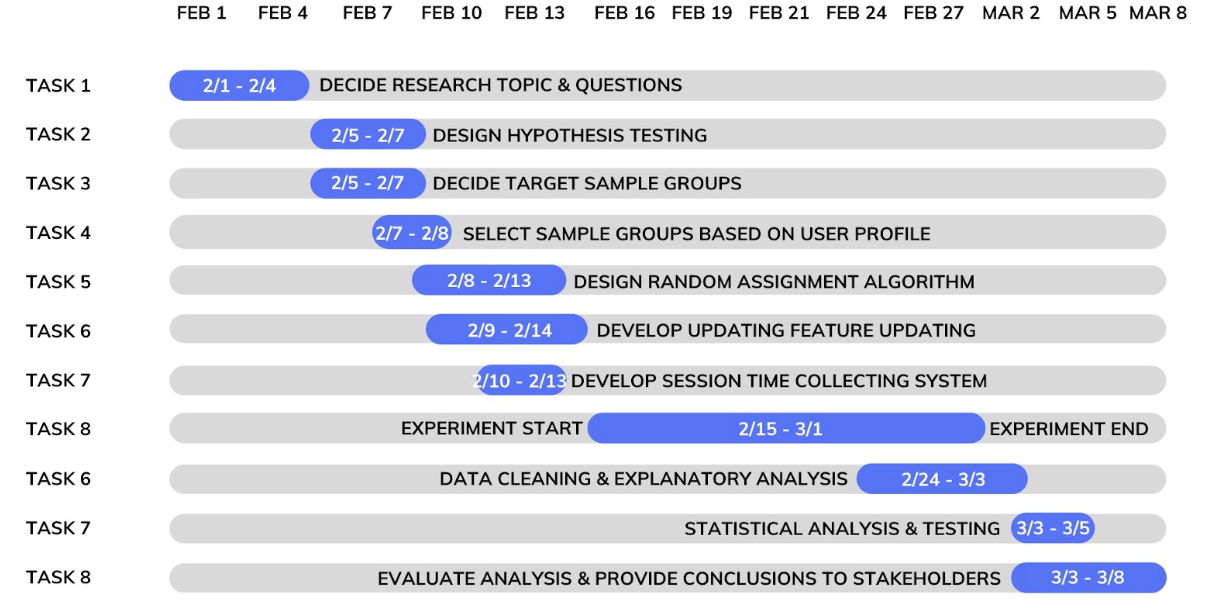
The whole study will last for about five weeks. The experiment will start on February 1st and end the study on March 8th. To avoid seasonal effects (eg. Thanksgiving and Christmans) on Instagram users’ shopping behavior, the experiment will run from February 15 to March 1.
Data Collection
The experiment will collaborate with Instagram where they will provide anonymized user data and upgrade several shopping interfaces for targeted users in their shopping feed to conduct the research. To collect the data we will collaborate with the product analysts at Instagram to measure the dependent variable for this feature testing. The dependent variable we are setting up is the daily average session time in seconds for the Shop feed for both treatment and the control groups. The data collection will be automated as a program set up by the engineers at Instagram when they begin the experiment of the feature testing. The program will log the session time in seconds when the user begins a session when they enter the Shop feed and ends a session after there is no activity after 10 minutes.
The average daily session time is recorded by taking the total session time in seconds in a day divided by the total number of sessions in a day and is logged in the database as an observation. Each of these events will be logged by group name which includes control, treatment 1, treatment 2, and treatment 3. The results and conclusions of this study will be provided to Instagram to aid in deciding which feature to release.
Data Security
The data would be provided by Instagram and user information will remain anonymous. The experiment only uses the following information to filter the qualified population: age, region, shopping history within the Instagram app, and time spent on the Shop feed. The experiment will not collect personal information such as names, addresses, and phone numbers. Only members of the research group are allowed to access the data collected. All data collected will not be used in other research/for other purposes. The result of this research will be provided to Instagram for further decision-making.
Outcomes (Dependent Variables)
The dependent variable of this study is the average daily session time of Instagram app users exposed to the Shop feed. This will be measured by recording each user’s session time in seconds every day. A session is started when a user is on the Shop feed and is actively engaging with the page. The session is ended when 10 minutes of inactivity is detected in a user. The average daily session time is calculated by dividing the total session time in seconds of a day by the total number of sessions for that day for each user. The names of the corresponding treatment groups will be recorded for each observation.
Treatments (Independent Variables)
Product Categorization:
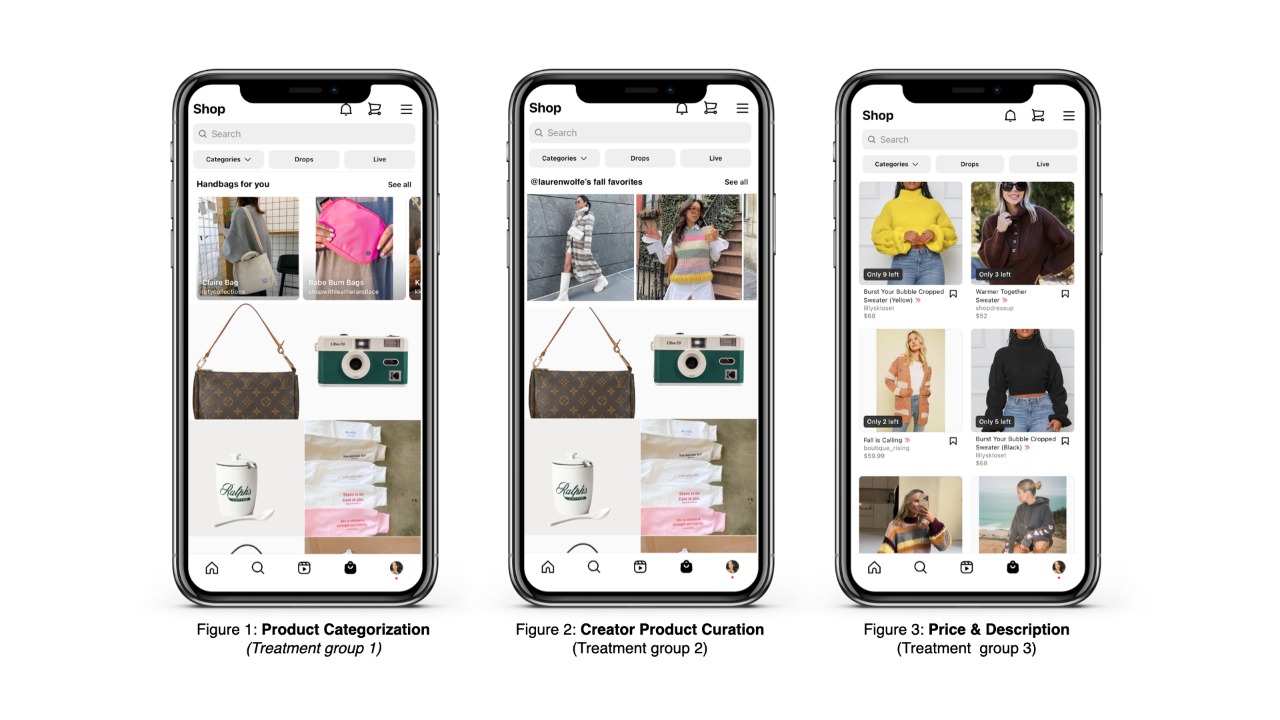
In the treatment 1 group, the users will be exposed to a Shop feed with a feature that includes the categorization of products for every four products shown in the feed as shown in figure 1. The treatment is administered to the subject’s Instagram account on their Shop feed the moment the experiment is started simultaneously with the control and other treatment groups. Each user will have different product categories based on their activity. The effect we are looking to observe is an increase in the users’ average daily session time on the Shop feed when exposed to a more curated shopping feed through product categorization. We hypothesize that the presence of product categorization will increase users’ average daily session time because it increases the relevance of the shopping experience. Product categorization increases consumers’ perceived variety of the assortment and reduces the perceived complexity of the products. These perceptions increase consumers’ purchase intention and satisfaction with the product (Rooderkerk & Lehmann, 2020).
Creator product curation:
In the treatment 2 group, the users will be exposed to a Shop feed with a feature that includes creator product curation for every four products shown in the feed. The treatment is administered to the subject’s Instagram account on their Shop feed the moment the experiment is started simultaneously with the control and other treatment groups. Creator product curation will be based on the creators users follow and the products shown will be a curated list of products that they recommend as seen in figure 2. Each user will have different creator product curations based on the creators they follow, however, the effect we are looking to observe is an increase in the users’ average daily session time on the Shop feed when exposed to a more curated shopping feed through creator product curation. We hypothesize that this feature will increase users’ average daily session time because it provides more relevant product recommendations. Findings from a study by Chen et al. (2018) show that product curation leads to more recommendations on the shop’s feed, which in turn boosts the average daily session time of most online customers.
Price and description:
In the treatment 3 group, the users will be exposed to a Shop feed with a feature that displays the price and description of a product for every product shown in the feed as seen in figure 3. The treatment is administered to the subject’s Instagram account on their Shop feed the moment the experiment is started simultaneously with the control and other treatment groups. We hypothesize that the presence of price and description will allow more transparency for users that are price sensitive and increase their average daily session time. According to Yahia, Al-Neama & Kerbache (2018), most potential customers who wish to buy products through the Instagram shop are usually more sensitive to the price of the products and their description than their relevance.
Other Variables
Participants’ gender, age, and demographic information should be recorded during the experiment because the nature of shopping habits from different groups would be different. Participants’ amount of time and day spent on the shopping feed should also be recorded for further studies and analysis. The conversion rate because of the feature change should also be recorded to check for results that might help the company to decide whether to do further research or implement immediately on the app to increase revenue stream.
Statistical Analysis Plan
The dependent variable of our study is the user’s average daily session time on Instagram’s shopping feed, and it is a continuous random variable. There are four levels of shopping feed feature updates, an ANOVA test will be performed to compare the means. The shopping feed updating feature is the only categorical independent variable, thus we will perform a one-way ANOVA. Assumptions of ANOVA test are satisfied because each collected session time is independent and identically distributed random variables. The variance of average daily session time is homoscedastic in each subgroup. We also assume the errors of the model have a normal distribution in R.
To adjust p-values while making pairwise comparisons, we will use Tukey’s HSD Method in R. This method allows us to test all pairwise differences while controlling the probability of making a Type I error. It is one of several tests designed for this purpose and fully controls this Type I error rate. The null hypotheses will be either rejected or failed to be rejected depending on the resulting p-values.
Sample Size and Statistical Power
As mentioned previously, an analysis of variance will analyze the results of each treatment group and the control group on the dependent variable (seconds spent on IG Shopping Feed). A power of 0.80 was selected as this will give us a 20% probability of falsely accepting the null hypothesis. A significance level of 0.05, meaning that there is a 5% probability or less of the research results being due to chance. Moreover, an effect size of 0.2 was used as, according to Cohen’s rules of thumb, it is considered a medium effect. The previous parameters were selected according to what is most accepted by the research community (Serdar, Cihan, Yücel, & Serdar, 2020).
Based on the previous parameters, 70 participants per group are estimated to be needed to detect a significant difference. In total, across all four groups, 280 Instagram users are going to be analyzed for this research. Sample size analysis was conducted using R Studio (RDocumentation Search all packages and functions, n.d.).
###### Sample Size One Factor Anova Calculation ######
library(pwr)
sample <- pwr.anova.test(k = 4, n = NULL, f = 0.2, sig.level = 0.05, power = 0.8)
n <- sample$n; n #[1] 69.12569
N <- 70*4 #Total sample size for four groups 280
Possible Recommendations
The following recommendations would be made to Instagram’s executives depending on each scenario:
Research Question 1: Categorization of Product
If the null hypothesis is accepted (there was no change between the control and treatment group), we would advise not releasing the categorization feature as it would be an impractical use of resources since no change was observed. On the other hand, if the null hypothesis is rejected (there was a significant and meaningful change between the control and treatment group), then we would recommend the company to develop a feature that categorized products inside the Shopping feed, as it would improve users’ average daily session time.
Research Question 2: Creator Product Curation
If the null hypothesis is accepted (there was no change between the control and treatment group), we would advise not releasing the product curation feature. Since there was no significant increase, developing this option would not be a smart business decision. Consequently, if the null hypothesis is rejected (there was a significant and meaningful change between the control and treatment group), then we would recommend the company develop a feature that has creator product curation in the Shopping feed, as it would increase users’ engagement inside the IG Shopping feed.
Research Question 3: Price & Description
If the null hypothesis is accepted (there was no change between the control and treatment group), we would advise realizing a feature that visualized the price and description of each item. Since the time spent on the feed was similar in both groups, developing the feature would require resources for no actual change in users’ behaviors. Moreover, if the null hypothesis is rejected (there was a significant and meaningful change between the control and treatment group), then we would advise the company to include the price and description of each of the items offered, as it would increase the time users spent on the Shopping feed.
Limitations and Uncertainties
This study has several limitations concerning authenticity. First, since our participants are chosen randomly and it’s hard to check on their real identities, there might be users who gave wrong personal information or something that might not be 100% real compared to their real identities. Moreover, some of our users might be unqualified shopping users because they might click on the shop feature accidentally rather than intentionally. These kinds of users are not the users that we try to target but rather try to avoid. However, the experiments were done in private and the responses were anonymous and respondents had little incentive to please the researcher, thus the result might not be significantly affected by the potential fake information.
Furthermore, the experiment would be more precise and accurate if the duration of the experiment was longer, however due to the ever-changing nature of social media, the timeline has to be compact in order to adapt to the real-world situation quickly. Lastly, the experiments do not measure the interactions between the independent variables, and the variables might affect each other accordingly, but these interactions might be realized in later studies for the future.
Part 2: Simulated Studies
Based on the 1,000 simulations of experiments conducted, each research question in scenarios with an effect and no effect resulted in a 50% accuracy and 50% precision rate and the following conclusions were made.
Scenario 1: No Effect
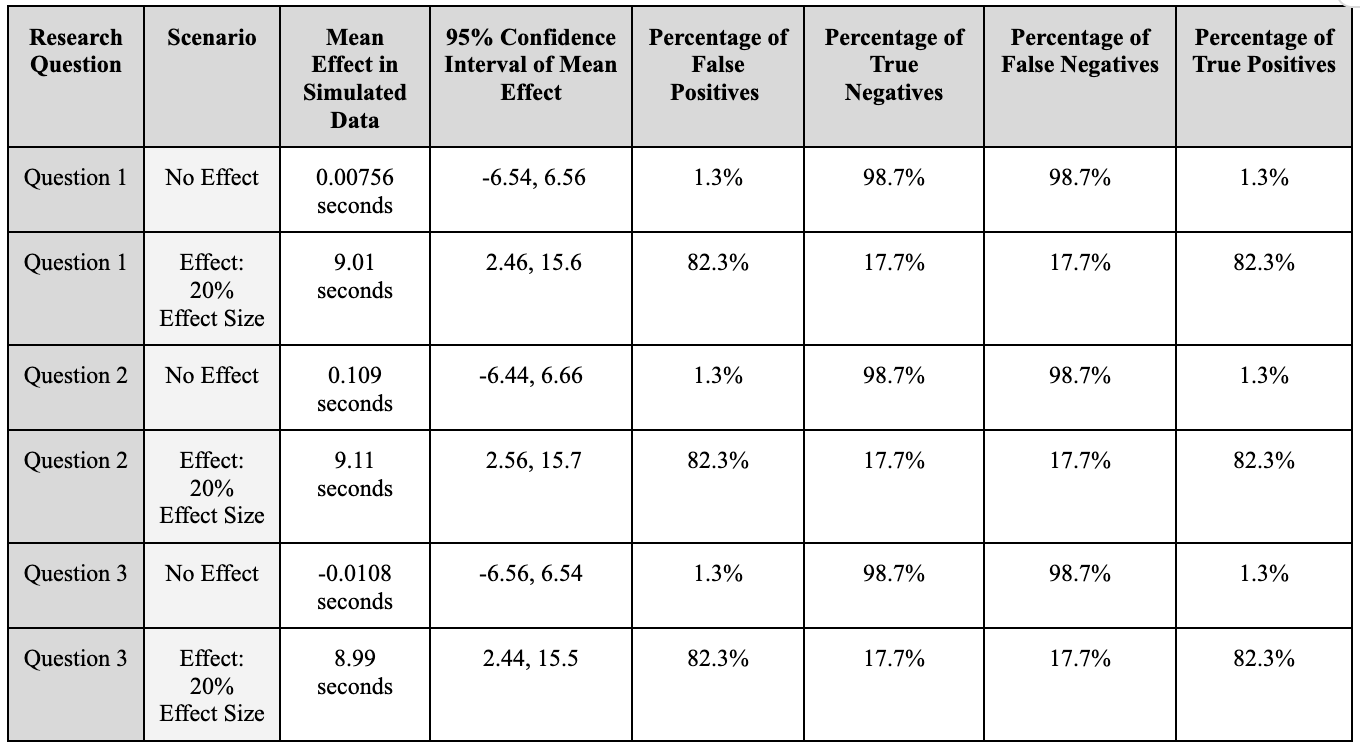
In the scenario of no effect a 98.7% of True Negative rate was observed in the three research questions with a high proportion of experiments with insignificant p-values, resulting in a mean effect size of 0.00756, 0.109, and -0.0108 seconds respectively. Indicating there is little to no improvement in users’ average daily session time when product categorization, creator product curation, and price and description features are present in the Shop feed. In addition, with 98.7% of False Negatives, resulting in a Type II error, the majority of our experiment does not predict accurately. Indicating that the null hypothesis should have been rejected but had failed to be rejected and there are significant effects that were not fully detected.
Thus, we are not able to make conclusions and recommendations of not releasing the product categorization (Research Question 1), creator product curation (Research Question 2), and price and description (Research Question 3) features to the Shop feed as there is no sufficient evidence for a change in strategy. Further adjustments need to be made for our experimental design to reduce Type II error.
Scenario 2: Expected Effect
In the scenario of an expected effect, 82.3% of True Positive rate was observed in the three research questions with a high proportion of significant p-values. This resulted in a mean effect size 9.01, 9.11, and 8.99 seconds respective to each research question. This indicates an improvement in users’ average daily session time and a ~20% effect size detected when product categorization, creator product curation, and price and description features are present in the Shop feed. However, we observed a high False Positive rate of 82.3%, resulting in a Type I error, indicating that there was a large proportion of experiments that falsely claimed that there is a statistically significant difference between the control and corresponding treatment groups.
Due to the high rates of Type I errors, we are not able to make conclusions and recommendations of releasing the three features as a change in strategy as the experiments had unreliable results. Instead the design of the experiment should be reassessed to improve the overall accuracy by reducing Type I errors.
Research Question 1-3
Scenario 1: No Effect
Simulation
A simulation of 1,000 experiments of the one factor ANOVA test with Tukey’s HSD correction were conducted in the scenario of no effect. The following assumptions were made to create the simulated data: A sample size of 280, with each group resulting in a sample size of 70. The standard deviation of 15 was assumed along with a control mean and treatment mean of 45 seconds to show no effect. For each research question the same treatment mean was applied as according to the null hypothesis. The table of simulated results are shown in Table 1.
####  Simulation Scenario With No Effect Size ####
library(data.table); library(dplyr)
N <- 280 #Sample Size
B <- 1000 #Number of experiments
SD <- 15 #Standard Deviation
CM <- 46 #Control Mean
TME <- 46 #Treatment Mean Without Effect

## Table to store Tukey Test Results ###
results <- data.table(matrix(ncol=6, nrow = 0))
colnames(results)[1:6] = c("experiment", "rn", "diff", "lwr", "upr", "p adj");results

### Repeatable Process for 1000 Experiments ###
set.seed(1020)
for (i in 1:B) {
  experiment <- c(i)
  groups <- rep(c("Control","Treatment1","Treatment2","Treatment3"), each = N/4) #Each = 58: Sample size per group
  DV <- c(rnorm(N/4,CM,SD),   # means for Control
          rnorm(N/4,TME,SD),   # means for Treatment1
          rnorm(N/4,TME,SD),   # means for Treatment2
          rnorm(N/4,TME,SD)    # means for Treatment3
  )
  sim_df<-data.frame(i,groups,DV)
  aov_model <- aov(DV~groups, sim_df)
  aov_results <- summary(aov_model)
  tukey.test <- TukeyHSD(aov_model)

  result <- data.table(tukey.test$groups[1:3,1:4], keep.rownames = T);result
  result <- cbind(result, experiment);result
  setcolorder(x = result, neworder = c("experiment", "rn", "diff", "lwr", "upr", "p adj")); result
  results <- rbindlist(list(results, result));results
}
Analysis
library(agricolae)

#Check for significant difference within the group in ANOVA
aov_results # p-value:  0.763

#Check that each experiment has unique values
head(results)
dim(results) #3 research questions x 1000 experiements = 3000 experiments
length(unique(results$`p adj`)) #3000 unique p values

#Check for normality
plot(aov_model, 2)

#Simulation Data Means by group
sim_df %>%
  group_by(groups) %>%
  summarize(mean(DV))

# Power 1.3%
results %>%
  group_by(rn) %>%
  summarize('Power %' = mean(results$`p adj`<0.05)*100)

#Summary of Observed Effect
results[rn == 'Treatment1-Control', summary(diff)]
results[rn == 'Treatment2-Control', summary(diff)]
results[rn == 'Treatment3-Control', summary(diff)]

### Table of Results Summarized
results %>%
  group_by(rn) %>%
  summarize('Mean Effect' = mean(diff),
            'Mean CI Lower Bound' = mean(lwr),
            'Mean CI Upper Bound' = mean(upr),
            "TN" = nrow(results[results$`p adj` > 0.05])/nrow(results)*100,
            "FP" = round(100-TN, 1),
            "TP" = nrow(results[results$`p adj` < 0.05])/nrow(results)*100,
            "FN" = round(100-TP, 1)) %>%
  select("rn", "Mean Effect", "Mean CI Lower Bound", "Mean CI Upper Bound", "FP","TN", "FN", "TP")
Research Question 1-3
Scenario 2: An Expected Effect
Simulation
A simulation of 1,000 experiments of the one factor ANOVA test with Tukey’s HSD correction were conducted in the scenario of no effect. The following assumptions were made to create the simulated data: A sample size of 280, with each group resulting in a sample size of 70. The standard deviation of 15 was assumed along with a control mean of 45 seconds and treatment mean with effect of 55 seconds. The treatment mean with effect was estimated based on a 20% expected increase from the control mean. For each research question the same treatment mean was applied as according to the 20% effect size that was deemed to be meaningful. The table of simulated results are shown in Table 1.
#### Simulation Scenario With Effect Size 20% ####
library(data.table); library(dplyr)
N <- 280 #Sample Size
B <- 1000 #Number of experiments
SD <- 15 #Standard Deviation
CM <- 46 #Control Mean
TME <- 55 #Treatment Mean With 20% Effect

## Table to store Tukey Test Results ###
results <- data.table(matrix(ncol=6, nrow = 0))
colnames(results)[1:6] = c("experiment", "rn", "diff", "lwr", "upr", "p adj");results

### Repeatable Process for 1000 Experiments ###
set.seed(1020)
for(i in 1:B){
  experiment <- c(i)
  groups <- rep(c("Control","Treatment1","Treatment2","Treatment3"), each = N/4) #Each = 58: Sample size per group
  DV <- c(rnorm(N/4,CM,SD),   # means for Control
          rnorm(N/4,TME,SD),   # means for Treatment1
          rnorm(N/4,TME,SD),   # means for Treatment2
          rnorm(N/4,TME,SD)    # means for Treatment3
        )
  sim_df<-data.frame(i,groups,DV)
  aov_model <- aov(DV~groups, sim_df)
  aov_results <- summary(aov_model)
  tukey.test <- TukeyHSD(aov_model)
  result <- data.table(tukey.test$groups[1:3,1:4], keep.rownames = T);result
  result <- cbind(result, experiment);result
  setcolorder(x = result, neworder = c("experiment", "rn", "diff", "lwr", "upr", "p adj")); result
  results <- rbindlist(list(results, result));results
}
Analysis
#### Analysis of Scenario with Effect ####

#Check for significant difference within the group in ANOVA
aov_results # p-value: 0.00027

#Check that each experiment has unique values
head(results)
dim(results) #3 research questions x 1000 experiements = 3000 experiments
length(unique(results$`p adj`)) #3000 unique p values

#Check for normality
plot(aov_model, 2)

#Simulation Data Means by group
sim_df %>%
  group_by(groups) %>%
  summarize(mean(DV))

#Power 82.3%
results %>%
  group_by(rn) %>%
  summarize('Power %' = mean(results$`p adj`<0.05)*100)


#Summary of Observed Effect
results[rn == 'Treatment1-Control', summary(diff)]
results[rn == 'Treatment2-Control', summary(diff)]
results[rn == 'Treatment3-Control', summary(diff)]


### Table Of Results Summarized
results %>%
  group_by(rn) %>%
  summarize('Mean Effect' = mean(diff),
            'Mean CI Lower Bound' = mean(lwr),
            'Mean CI Upper Bound' = mean(upr),
            "TN" = nrow(results[results$`p adj` > 0.05])/nrow(results)*100,
            "FP" = round(100-TN, 1),
            "TP" = nrow(results[results$`p adj` < 0.05])/nrow(results)*100,
            "FN" = round(100-TP, 1)) %>%
  select("rn", "Mean Effect", "Mean CI Lower Bound", "Mean CI Upper Bound", "FP","TN", "FN", "TP")
References
Brewster, M. (2022, October 3). Annual retail trade survey shows impact of online shopping on retail sales during COVID-19 pandemic. Census.gov. Retrieved from United States Census: https://www.census.gov/library/stories/2022/04/ecommerce-sales-surged-during-pandemic.html
Cetinturk, N. (2019). Evaluating the Digital Marketing Metrics: The Relationship of Average Session Duration to Sales Performance. Retrieved from ResearchGate: https://www.researchgate.net/publication/338986068
Chen, T., Fenyo, K., Yang, S., & Zhang, J. (2018). Thinking inside the subscription box: new research on e-commerce consumers.. Retrieved from McKinsey: https://www.mckinsey.com/~/media/McKinsey/Industries/Technology%20Media%20and%20Telecommunications/High%20Tech/Our%20Insights/Thinking%20inside%20the%20subscription%20box%20New%20research%20on%20ecommerce%20consumers/Thinking-inside-the-subscription-box-New-research-on-ecommerce-consumers.pdf
Contentsquare. (2022). Digital Experience Benchmark Report. Retrieved from Contentsquare: https://contentsquare.com/insights/digital-experience-benchmark/
Geyser, W. (2022, July 21). 12 Social Commerce Platform Examples That Prove Social Is Key. Retrieved from Influencer Marketing Hub: https://influencermarketinghub.com/social-commerce-platform/
Gokila, V. (2021, April 20). A study on the growth of e-commerce during COVID-19. Retrieved from SSRN: https://papers.ssrn.com/sol3/papers.cfm?abstract_id=3828398
Hu, M., & Chaudhry, S. S. (2020, March 5). Enhancing consumer engagement in e-commerce live streaming via relational bonds. Retrieved from Emerald Insight: https://www.emerald.com/insight/content/doi/10.1108/INTR-03-2019-0082/full/html
Instagram. (2022). Instagram Shopping. Retrieved from Instagram: https://business.instagram.com/shopping
Instagram. (2022). Availability of shopping features on Instagram: Help center. Availability of shopping features on Instagram Help Center. (n.d.). Retrieved November 13, 2022, from https://help.instagram.com/321000045119159
Lipsman, A. (2021, February 5). US social commerce is following in China’s footsteps. Retrieved from Insider Intelligence: https://www.insiderintelligence.com/content/us-social-commerce-following-chinas-footsteps
Murdoch, R., Wright, O., Fang, K., Collins, K., & McCracken, L. (2022, January 4). The future of shopping and social commerce. Retrieved from Accenture: https://newsroom.accenture.com/news/shopping-on-social-media-platforms-expected-to-reach-1-2-trillion-globally-by-2025-new-accenture-study-finds.htm
Osman, M. (2022, September 19). Ecommerce statistics for 2022 - Chatbots, voice, Omni-channel marketing. Kinsta. Retrieved November 13, 2022, from https://kinsta.com/blog/ecommerce-statistics/#digging-into-ecommerce-demographics
Pixlee TurnTo. (2022, October 12). The top industries using Instagram: Pixlee Turnto Blog. Pixlee TurnTo. Retrieved November 16, 2022, from https://www.pixlee.com/blog/the-top-industries-using-instagram
RDocumentation Search all packages and functions. (n.d.). pwr.anova.test: Power calculations for balanced one-way analysis of variance tests. Retrieved from RDocumentation: https://www.rdocumentation.org/packages/pwr/versions/1.3-0/topics/pwr.anova.test
Rooderkerk, R.P. and Lehmann, D.R. (2020) Incorporating Consumer Product Categorizations into Shelf Layout Design. Retrieved from SAGE Journals: https://journals.sagepub.com/doi/10.1177/0022243720964127
Singh, M., & Singh, G. (2018). Impact of social media on e-commerce. International Journal of Engineering and Technology(UAE), 21-26.
Serdar CC, Cihan M, Yücel D, Serdar MA. Sample size, power and effect size revisited: simplified and practical approaches in pre-clinical, clinical and laboratory studies. Biochem Med (Zagreb). 2021 Feb 15;31(1):010502. doi: 10.11613/BM.2021.010502. Epub 2020 Dec 15. PMID: 33380887; PMCID: PMC7745163.
Suchánek, P., & Králová, M. (n.d.). Effect of customer satisfaction on company performance - researchgate. Retrieved from ResearchGate: https://www.researchgate.net/publication/281314808_Effect_of_Customer_Satisfaction_on_Company_Performance/fulltext/5673ff0008aedbbb3fa1ad29/Effect-of-Customer-Satisfaction-on-Company-Performance.pdf
Vazquez, E. E., Ruiz, D. D., & Martinez, J. C. G. (2020). Influence of consumer product categorization on digital sales: The mediating effect of conversion rate. Retrieved from European Journal of Applied Business and Management, 6(4): https://nidisag.isag.pt/index.php/IJAM/article/view/517
Weeks, J. B., Smith, K. M., & Hulland, J. (2021). Consumer brand curation on social shopping sites. Retrieved from Journal of Business Research, 133, 399-408: https://www.sciencedirect.com/science/article/abs/pii/S0148296321003398?via%3Dihub
Yahia, I. B., Al-Neama, N., & Kerbache, L. (2018). Investigating the drivers for social commerce in social media platforms: Importance of trust, social support, and the platform perceived usage. Retrieved from Journal of Retailing and Consumer Services, 41, 11-19: https://www.sciencedirect.com/science/article/abs/pii/S0969698917301315?via%3Dihub
Zhou, L. Z., Zhang, P., & Zimmermann, H.-D. Z. (2013). Social commerce research: An integrated view . ScienceDirect, 61-68. https://www.sciencedirect.com/science/article/pii/S1567422313000148?casa_token=SjETZ963MMkAAAAA:3ex74aZiBGEbPkxuYoOnJ3ChL1ZKetw6RUfrJmQ7H28YROWSigiJLvykif3ssjdAlR8xF3K4-A